Spend enough time in enterprise retail, and a pattern becomes hard to ignore. Organizations pour resources into store redesigns, personalisation platforms, and fulfillment upgrades, and still haemorrhage revenue at the very moment a customer decides to pay.
Checkout. The last ten seconds of a transaction that took hours or weeks to engineer.
The frustrating reality for many retail CTOs is that checkout dysfunction rarely announces itself loudly. Systems stay online. Payments clear. Reports show green.
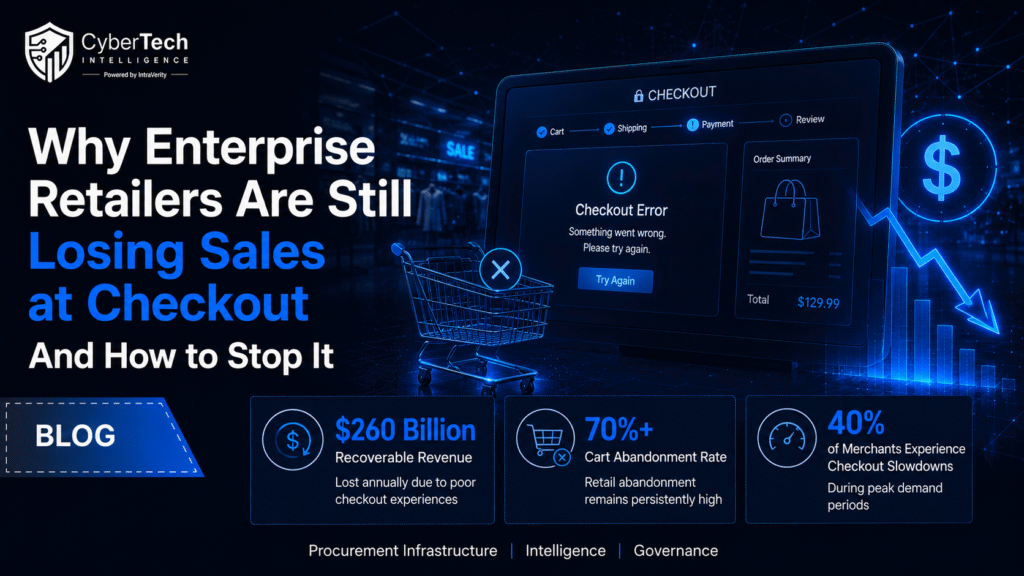
Baymard Institute puts the number at $260 billion, the value of orders lost annually in the US and EU markets alone that are recoverable purely through better checkout design. For enterprise retail CTOs, that figure reframes the conversation entirely. 1
This isn’t a technology maintenance problem. It’s one of the largest addressable revenue opportunities sitting inside the business right now.
Yet, conversion quietly bleeds away, and the causes sit buried in failure modes that standard operational dashboards were never built to surface.
The Gap Between Knowing and Diagnosing
Ask most senior retail leaders whether checkout is a problem and the answer is yes. Ask them exactly where it’s breaking, which touchpoints, which payment flows, which customer segments and the answer gets murkier.
That gap between general awareness and precise diagnosis is where the revenue leaks. Cart abandonment across retail categories has stubbornly held above 70% for years, and a meaningful portion of that figure has nothing to do with price or intent. 2
Customers who wanted to buy, couldn’t, or wouldn’t complete the process. At enterprise scale, even a one-percentage-point improvement in checkout conversion can move the needle by tens of millions annually. The inverse is equally true.
The question that should be occupying every retailer’s mind is not whether or not the friction involved with the checkout process costs their business, because undoubtedly, it does. The question that must be answered is how and where.
Five Places Checkout Breaks That Often Go Unexamined
Across enterprise retail environments, spanning physical stores, e-commerce, app, and kiosk, the same failure patterns surface repeatedly.
-
Payment method availability at the moment of commitment
A shopper reaches the checkout ready to pay using their preferred method. It isn’t offered. Or it’s offered but fails silently. The sale disappears, and it rarely shows up as a payment failure in post-transaction reporting; it just doesn’t happen.
With the payments landscape continuing to fragment across digital wallets, BNPL products, account-to-account rails, and modernised EBT infrastructure, “preferred” covers an increasingly wide range of options.
Retailers whose payment stack was configured two or three years ago and hasn’t been meaningfully reviewed since are almost certainly losing transactions they have no visibility into.
-
Infrastructure that holds until it matters most
Peak periods, seasonal sales, promotional events and product launches are precisely when checkout performance is most commercially valuable. They’re also when system strain is highest.
Over 40% of merchants have reported checkout system slowdowns during demand surges, and when those slowdowns hit, the losses concentrate fast. 3
Research points to a significant share of affected businesses losing upwards of $100,000 per incident. This isn’t a fringe risk; it’s a predictable structural vulnerability for any retailer operating on legacy checkout infrastructure. 3
-
Channel inconsistency that erodes trust
Enterprise retailers have spent years building omnichannel capability. However, the checkout process itself has often fallen behind. For instance, if there are different payment choices in-store compared to online.
If the checkout process on the app is less smooth than that for the desktop version, or if transactions on the kiosk differ from those at the counter.
This inconsistency affects the consumer’s perception of unreliability, despite not being able to explain why. Trust erodes incrementally and rarely traces back to checkout in customer feedback.
-
Authorization failures no one reports
This is the failure mode that causes the most damage relative to how rarely it’s discussed. A payment authorization fails. The customer isn’t clearly informed. They assume the transaction went through, leave, and discover the problem later, or don’t, and wait for a delivery that never comes.
The retailer loses the sale and potentially the customer. No alarm fires. At scale, these incidents aggregate into a gap that shows up in revenue figures but rarely in system alerts.
-
UX debt in the checkout flow itself
The POS system, the integration of which was done without proper planning, and the checkout process, which was not designed according to consumer behavior, all result in a checkout system that works but is dysfunctional.
The friction is invisible to infrastructure teams but entirely visible to the customer who abandons a basket because the process felt too slow, too confusing, or asked for one step too many.
Executive Analysis: Bridging the Checkout Conversion Gap
Companies spend money on store design, personalization systems, and delivery enhancements, yet they can’t stop leaking money when the customer reaches that most critical of moments – when they want to hand over their cash: the checkout procedure. The difficult truth for many retail CTOs is that broken checkout operations do not tend to make themselves known.
According to the Baymard Institute, there are orders worth $260 billion that are lost each year just in the US and EU markets. Most important, this huge loss is completely recoverable solely by improving the checkout experience. In terms of the enterprise retail CTOs, this number puts things into an entirely new context. 1
This isn’t a technology upkeep issue – it’s one of the biggest revenue generating opportunities hiding within the organization. However, this potential is quietly squandered since the underlying issues lie hidden in failure modes undetectable using normal business dashboards.
What Retailers Who Are Getting This Right Have in Common
The distinguishing factor among retailers who have materially improved checkout performance isn’t a particular technology platform or vendor relationship. It’s how they think about the problem.
Checkout is treated as a strategic performance system with its own diagnostic cadence, not a piece of operational infrastructure that gets attention when something breaks. That means regular auditing that goes beyond uptime: tracking authorization rates by payment method, correlating UX friction data with abandonment points, and building feedback loops that connect checkout performance metrics to technology investment decisions at the senior level.
It also means executive ownership. The retailers seeing the most consistent improvement have a named CTO-level stakeholder accountable for checkout performance as a business outcome, not just as a technology responsibility.
Starting the Diagnostic Conversation
For retail technology leaders, the most immediate practical step is a structured checkout audit, a deliberate, cross-channel review of where performance is degrading and what it’s costing. Checkout efficiency is not a one-time activity but an ongoing practice.
The effectiveness of the checkout will gradually decline due to changes in consumer behavior, increased transactions, and widening differences between existing systems and customer expectations.
The failure points are increasingly well documented. The remediation paths, in most cases, are understood. What separates the retailers still losing sales at checkout from those fixing it is the organisational decision to treat it as a priority that warrants the same rigour applied to any other major revenue driver.
Ready to Go Further?
If checkout performance is on your agenda, the upcoming webinar goes further, with data, retail case studies, and frameworks built for enterprise teams ready to move from diagnosis to action.
Register now: Where Checkout Still Breaks and How Retailers Are Fixing It
A practical session for retail technology leaders examining where checkout is still falling short, and the strategies operators are using to fix it.
FAQs
-
What is causing the drop-off at checkout?
Checkout drop-off is usually not the result of a problem with the system, but rather the sum total of little irritations along the way to check-out – payment methods that no longer meet the requirements of shoppers, authorization issues that do not make themselves known, or UX stages that were valid three years ago but no longer fit with today’s consumer needs.
-
How will we ever know whether checkout friction is really impacting revenue losses, or if the drop-off is just normal shopper behavior?
For most retailers, there is simply no way to distinguish between revenue losses due to checkout friction and the natural abandonment that occurs when shoppers abandon their carts.
-
Why does our checkout perform well during tests but poorly in reality?
Test environments simply do not emulate the high load scenarios, a diverse set of devices and payment instruments used by actual customers. In case the checkouts run perfectly through the tests conducted without any problems, the system will be unable to handle the massive number of customers on Black Friday, fail silently for an older Android phone, or even reject a legitimate purchase because of insufficient tests for the BNPL implementation..
-
Is it a technology issue or an operations issue?
Technical failure points, authorization rates, infrastructure stability, coverage of the payment stack – they all belong to IT/Engineering. However, the decision to prioritize the checkout system as one critical for revenue generation, allocate funding for diagnostics, and take responsibility for performance metrics is operational and managerial.
-
What’s a realistic starting point for a retailer that wants to get serious about fixing checkout?
Start with a cross-channel audit rather than a technology procurement decision. Map where drop-off happens, which payment methods have the highest failure rates, where authorization issues concentrate, and what the UX flow looks like from a first-time shopper’s perspective on mobile.
References
- The Baymard Institute (2026) lists over 40 UX statistics in their article, 40+ UX Statistics (from 200000 hours of UX Research). The reference is typically formatted as: Baymard Institute (2026) 40+ UX Statistics (from 200000 hours of UX Research). Available at: https://baymard.com/learn/ux-statistics (Accessed: 29 May 2026).
- Kronenthal, C. (2025) ‘Tis the season for availability: how retailers are preparing for a seamless peak season’, RETHINK Retail, 22 December. Available at: https://rethink.industries/articles/tis-the-season-for-availability-how-retailers-are-preparing-for-a-seamless-peak-season/ (Accessed: 29 May 2026).
Note: The article is authored/attributed to FreedomPay’s Chris Kronenthal as a key cited source within it. If no named author is visible on the page, use the organisational author format below instead:
3. Department for Science, Innovation and Technology (DSIT) and Home Office (2026) Cyber security breaches survey 2025/2026 [Official Statistics]. London: GOV.UK, 30 April. Available at: https://www.gov.uk/government/statistics/cyber- security-breaches-survey-20252026/cyber-security-breaches-survey-20252026 (Accessed: 29 May 202
🔒 Login or Register to continue reading