Executive Summary
Checkout friction is no longer a UX problem sitting on the IT backlog. It is one of the most quantifiable sources of revenue loss in enterprise retail and one of the most actionable.
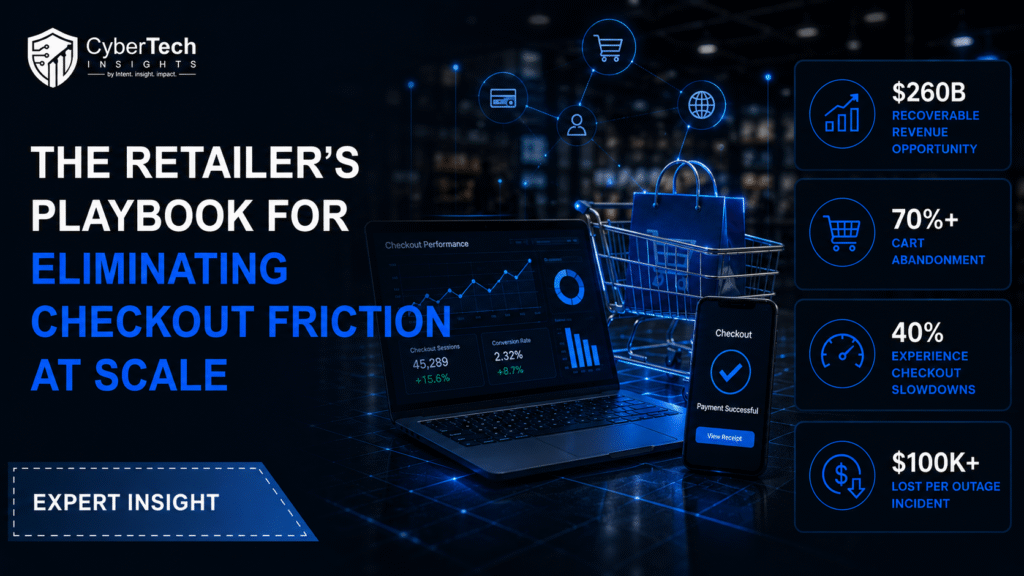
Baymard Institute’s analysis of 50 studies confirms the global cart abandonment rate has held at 70.22% for over a decade, with $260 billion in orders recoverable annually in the US and EU through better checkout design alone. 1
The checkout friction reduction technologies market, valued at $4.2 billion in 2025, is projected to reach $10.3 billion by 2036, a clear signal that the industry has moved from recognising the problem to funding its resolution. 2
This briefing sets out the four strategic pillars that distinguish enterprise retailers making measurable progress on checkout performance from those still treating it as a maintenance issue.
The Scale Problem Enterprise Retailers Face
Checkout friction at enterprise scale does not behave like checkout friction at a mid-market or SMB level. The same failure modes exist: payment method gaps, UX complexity, authorisation failures, and infrastructure degradation under load, but the consequences compound differently.
A one-percentage-point improvement in checkout conversion across an enterprise retailer processing millions of transactions annually is not a marginal gain. It is a material revenue event.
Conversely, failure concentrates at the worst possible moments. Research from FreedomPay and Dynatrace found that 61% of payment outages occur during peak trading periods, precisely when transaction volume and revenue opportunity are highest. 3
For enterprise retailers, the question is not whether these failure points exist. It is whether the organisation has the structural discipline to address them at scale.
The retailers pulling ahead are not those with the most sophisticated technology stacks. They are the ones who have built checkout improvement into their operating model, with diagnostic cadences, clear ownership, and performance metrics that connect directly to commercial outcomes.
Pillar 1: Payment Stack Modernisation
The strategic imperative: Close the gap between the payment methods your infrastructure supports and the payment methods your customers actually use.
The payments landscape has fragmented significantly. Digital wallets now account for 53% of all global ecommerce transactions. Buy Now Pay Later has moved from niche to mainstream, with BNPL availability reducing abandonment rates by an average of 20% for orders over $100, rising to 29% among shoppers aged 18 to 34.
Yet PYMNTS Intelligence data shows that only 22% of consumers feel retail brand websites consistently offer their preferred payment method, even though 70% cite payment method availability as highly influential in their purchase decisions. 4
For enterprise retailers, this gap represents a direct and measurable conversion leak. The remediation path requires a structured audit of current payment method coverage against actual shopper behaviour data, a clear view of which payment methods are generating silent failures versus user-facing declines, and a modernisation roadmap that prioritises coverage gaps by transaction volume and customer segment.
Key metric to track: Authorisation rate by payment method, segmented by channel, device type, and customer cohort.
Pillar 2: Infrastructure Resilience and Performance Under Load
The strategic imperative: Build checkout infrastructure that holds performance standards at peak demand, not just in baseline conditions.
The checkout infrastructure problem at enterprise scale is not one of average performance. It is one of the degradations under load. Systems that clear QA and perform acceptably during normal trading windows can buckle under Black Friday traffic, fail silently during product launches, or introduce latency that compounds into measurable abandonment at the moments when conversion matters most.
A 10-second checkout delay across 2,000 stores generates 1.6 million hours of lost customer time. Forbes estimates system downtime costs up to $9,000 per minute in lost revenue. These are not theoretical risks; they are predictable outcomes of infrastructure that was designed for average load, not peak demand. 5
Enterprise retailers addressing this systematically are investing in three areas: load testing that accurately simulates peak trading conditions rather than expected average volumes; payment redundancy architecture that ensures a single provider failure does not become a conversion failure; and real-time performance monitoring that surfaces degradation before it becomes an incident rather than after.
Key metric to track: Checkout completion rate during peak versus off-peak periods, with decline data disaggregated by failure type.
Pillar 3: Omnichannel Checkout Consistency
The strategic imperative: Deliver parity in payment options, UX quality, and performance standards across every channel, in-store, online, app, and kiosk.
The mobile abandonment gap is the most visible indicator of omnichannel checkout inconsistency. Mobile cart abandonment sits at 80.02% compared to 66.41% on desktop, a 14-point spread that reflects checkout flows designed for one context and inadequately adapted for another. 1
Enterprise retailers with significant in-store footprints face a more complex version of the same issue: ensuring that the payment methods available at the POS reflect the same range available online, that self-checkout experiences perform to the same standard as staffed registers, and that cross-channel shopper journeys, buy online, pick up in-store, return in-store for an online purchase, don’t create friction at the point of reconciliation.
Retailers making progress here have moved from channel-by-channel checkout management to a unified checkout performance view, a single framework that sets parity standards across touchpoints and tracks performance against them consistently.
Key metric to track: Abandonment rate and payment method completion rates by channel, with gap analysis between the highest and lowest performing touchpoints.
Pillar 4: Checkout UX as a Continuous Discipline
The strategic imperative: Treat checkout UX as an ongoing performance system, not a design decision made at implementation and revisited only during platform migrations.
Baymard Institute research identifies that addressing documented checkout usability issues can improve conversion rates by up to 35%. The average retail site has 39 identifiable improvement areas in the checkout flow. Most go unaddressed, not because the fixes are technically complex, but because there is no operational structure for finding and prioritising them on a continuous basis.
The highest-impact UX friction points are well established. Requiring account creation before purchase drives 24% of abandonments. Complicated multi-step checkout flows account for 18% of drop-off. Unexpected costs surfaced at the payment page, causing 48% of abandonments, the single largest driver across all categories. 1
One-page checkout implementations reduce abandonment by 20% on average. These are not new findings. They persist because most enterprise retailers lack the operational cadence to systematically address them. 1
The retailers closing this gap have built checkout UX into their experimentation roadmaps, with step-level analytics that identify exactly where drop-off occurs, A/B testing pipelines that validate fixes before full deployment, and review cycles tied to business outcomes rather than platform release schedules.
Key metric to track: Step-level drop-off rate through the checkout funnel, with particular attention to the payment method selection and order confirmation stages.
The Organisational Dimension
The four pillars above are operational. But the most consistent differentiator between retailers making progress and those still firefighting the same checkout problems year after year is organisational: who owns checkout performance, and what are they accountable for?
When checkout sits purely within IT, it is managed as infrastructure. Incidents are triaged. Uptime is tracked. But the commercial dimension, conversion rates, payment method coverage, and UX performance rarely have a named owner at a level where it connects to revenue decisions. Among retailers demonstrably improving checkout outcomes, CTO-level ownership of checkout as a business performance system, not just a technology responsibility, is the common thread.
That ownership needs to be supported by the right measurement framework. Uptime and transaction success rates are necessary but insufficient. The metrics that drive improvement are conversion-oriented: checkout completion rate by channel, authorisation rate by payment method, step-level abandonment data, and performance variance between peak and off-peak conditions.
Immediate Next Steps for Enterprise Retail Leaders
1. Commission a cross-channel checkout audit. Map performance across every touchpoint. Identify where conversion drops, which payment methods generate failures, and where UX debt is highest. Base the audit on transaction data, not system uptime reports.
2. Establish CTO-level ownership of checkout performance. Define the metrics, set the targets, and build a reporting cadence that connects checkout performance directly to commercial outcomes.
3. Build a six-month improvement roadmap. Prioritise by revenue impact, the failure points with the highest transaction volumes and the most addressable root causes come first. Tie each initiative to a measurable conversion outcome.
4. Move from incident response to continuous improvement. Checkout performance degrades continuously as shopper behaviour evolves and transaction volumes grow. The retailers ahead of this problem have built the operational discipline to stay ahead of it, not just react to it.
Explore Further
This briefing provides the strategic framework. The details, retail case studies, operational data, and the specific approaches leading retailers are deploying right now will be covered in the upcoming webinar.
Register now → Where Checkout Still Breaks and How Retailers Are Fixing It
A deep-dive session for retail technology leaders and senior decision-makers, examining the checkout failure points still impacting conversion at scale and the strategies operators are using to fix them.
References
- Baymard Institute (2025) Cart abandonment rate statistics. Available at: https://baymard.com/lists/cart-abandonment-rate (Accessed: 29 May 2026).
- PwC (2017) Frictionless retail: The future of shopping. Available at: https://www.pwc.co.uk/industries/documents/frictionless-retail-the-future-of-shopping.pdf (Accessed: 29 May 2026).
- FreedomPay (2025) Payment outages threaten £1.6 billion in UK retail and hospitality sales [Press release]. Available at: https://corporate.freedompay.com/about-us/press-release/payment-outages-threaten-1-6-billion-in-uk-retail-hospitality-sales (Accessed: 29 May 2026).
- PYMNTS (2025) 70% of shoppers prioritize payment method when deciding where to shop. Available at: https://www.pymnts.com/checkout-conversion/2025/70-percent-of-shoppers-prioritize-payment-method-when-deciding-where-to-shop/ (Accessed: 29 May 2026).
- Forbes Technology Council (2024) ‘The true cost of downtime and how to avoid it’, Forbes, 10 April. Available at: https://www.forbes.com/councils/forbestechcouncil/2024/04/10/the-true-cost-of-downtime-and-how-to-avoid-it/ (Accessed: 29 May 2026).
🔒 Login or Register to continue reading